01Evidence
It replaces a neural model that it beat.
Measured against 1,063 tool calls labelled from 18 real sessions: thirteen coefficients over facts already computed for free, against a neural model that runs locally.
The plugin started as a port onto a 322M‑parameter decision model. The logistic beat every checkpoint and question wording it was asked.
|
0.50 chance, the left edge of this scale; each bar below runs from 0.50 to 1.00 and its value is printed beside it.
0.70
0.90
1.00
|
||
| Built‑in scorer12 of 13 coefficients fitted |
|
0.905 ± 0.078worst split 0.684 |
|---|---|---|
| Output size aloneone raw feature, nothing fitted |
|
0.878 ± 0.010most of the signal |
| Neural, typed‑decisions“direct” wording |
|
0.719 ± 0.026best of nine configs |
| Neural, multilingual“direct” wording |
|
0.667 ± 0.023 |
| Neural, English“entailment” wording |
|
0.625 ± 0.016 |
| Keep everythingno scoring | 0.500the coin flip |
The built-in scorer won 10 of 10 paired splits, by +0.186 on average and by +0.018 on the closest.
Held out one session at a time across all 41, the same scorer gets 0.789, not 0.905. That is the number to plan around.
AUC is the chance a needed output outranks an unneeded one; calibration error is how far the probabilities are from the truth. Read the bar as the narrow corpus: 30% of 18 sessions held out each split, split by session because calls inside one are correlated, every scorer judged on the same held-out sessions, which is what makes it paired. Its calibration error is 0.044 against every neural config’s 0.380–0.642. What ships is fitted on all 41 sessions, where the same measurement gives 0.789 and 0.051: the gaps in section 08 says why that is the pair to plan around.
The same scorer, on a harness it never saw
Run unchanged on 108 tool calls from 7 Codex CLI sessions, the shipped scorer is a coin flip. Refit on those same sessions’ own labels, it recovers — which is why the answer is to calibrate per context, not to ship one set of weights for every harness.
-
Ranking qualityAUC, 0.50 is chance
shipped default, on Codex 0.469 below chancerefit on those sessions 0.904 -
Tokens freedat 85% of calls kept
shipped default, on Codex 1.3%refit on those sessions 67.5%
~/.codex and committed as scrubbed
aggregates, so treat it as directional. The AUC bar for the shipped default is empty because
0.469 is below the 0.50 coin flip. The recovery is the point: the same thirteen features
carry the signal once their weights are fit to the harness in front of them, which is what
calibrate --contribute is for.02Watch it decide
Nine calls, two probabilities each, one ranking.
A real session: a test that fails only on CI, traced to a timezone in a fixture, then fixed. Below is what the shipped scorer did to it.
Every row was written into this page when the demonstration was generated, with nothing overridden. The five outcomes are defined in the glossary, and Replay re-runs the decisions in the order the ranking spends them, lowest first.
- Bashnpm test -- auth.spec.tskeep-result 0.158 · keep-call 0.973
7,186 chhead onlyKept 386 of 7,186 characters: the head, and a line saying it was shortened. - Readsrc/auth.tskeep-result 0.762 · keep-call 0.946
36,341 chcapped - GrepJWT_SECRETkeep-result 0.020 · keep-call 0.037
89 chtoo small - Readsrc/config.tskeep-result 0.282 · keep-call 0.270
14,026 chkept - Bashgit log --oneline -20 -- src/auth.tskeep-result 0.081 · keep-call 0.093
1,547 chdropped1,547 characters of output, 1,597 freed: dropping a call takes its input with it. - Read.github/workflows/ci.ymlkeep-result 0.282 · keep-call 0.270
5,615 chkept - Bashgh run view 4821 --log | tail -60keep-result 0.228 · keep-call 0.305
49,001 chcapped - Editsrc/auth.tskeep-result 1.000 · keep-call 1.000
29 chpinned - Bashnpm test -- auth.spec.tskeep-result 1.000 · keep-call 1.000
2,432 chpinned
How do I read a bar?
The outline is how big that result was against the largest in the session; the filled part is how much of it survived.
Is this a real session?
The transcript is constructed, because every real session on this machine is someone’s
work and this page is public. The decisions are not: the shipped scorer produced
this list with the shipped defaults, and npm run docs:demo
regenerates it.
Did it ever drop something that mattered?
Yes. The first run dropped the Edit that fixed the bug, and both its scores
were low honestly: “Applied 1 edit to src/auth.ts” is worth nothing. So a
mutating call is no longer the scorer’s to decide. Its input is the only record the
change happened and re-running cannot recover it, so Edit, Write,
MultiEdit and NotebookEdit keep their call whatever the
probabilities say. Re-running the corpus without that guard prices it: 15 of the 220
mutating calls would otherwise lose something, not 220.
Why is a Grep scoring 0.020 still kept?
Dropping it frees 126 characters, more than the 89 its result holds, because the call goes with it. Thirty tokens, against a real chance of losing something still needed. Below minYieldChars the ranking is not worth acting on however confident it is, so that call reads too small rather than dropped.
And then it does it again.
One compaction is not the product; the loop is. The engine asks at 62% of the window, this answers, you keep working, and it asks again. Each answer costs about 8 ms and hands back 9 points of window, so the model summary, which is a model call and rewrites your session into prose, runs after the sixth of them rather than the first.
- pass 1held 51.6% of the window, −10.5pts13 ms
- pass 2held 53.2% of the window, −10.2pts9 ms
- pass 3held 52.8% of the window, −9.2pts8 ms
- pass 4held 53.9% of the window, −8.2pts8 ms
- pass 5held 55.1% of the window, −7.0pts7 ms
- pass 6held 55.6% of the window, −6.6pts8 ms
- hand overheld 55.6% of the window, −6.7pts6 passes is the ceiling
One real session of 10,331 messages, replayed against a
200k‑token window. The dark part of each bar is what the session was still
holding; the red part is what that pass handed back. Of 5 sessions measured on one
machine, 4 looped at all, and between them the loop answered 10
compactions that would otherwise each have been a model summary. A dated snapshot of one
machine's transcripts, which grow as you work. npm run dry-run re-runs it
on yours.
Why a percentage of the window, and not of the session
The rule used to be minReductionRatio: 0.25: take the pass if it removed a quarter
of the transcript. Replayed on real sessions that bar took
0 of 15
passes. Every one went to the model summary while this could still free 9
points of window in under 13 ms.
The unit was the mistake. A quarter of a 10,331-message session and a quarter of a 200-message one are not the same amount of room to keep working in, and room is what runs out. Points of the window are comparable, and they are the same unit as the 62% trigger, which makes the rule its own guard: the dashed line above is the floor, and a pass is only taken if it lands below it. Growing back through those 5 points is what stops a compaction on every turn.
The ceiling is maxPasses: 6, and on the session drawn above it is what
ends the loop rather than the floor. That is deliberate: what
deferring the summary costs is not measured, and a backstop
whose value is a judgement should be the conservative one.
Every dropped result leaves a note and notes are never removed, so the standing worry is that a transcript fills up with receipts. Measured, it does not.
The extra passes are not free. Replayed over 32 sessions, the loop drops 17 outputs a later step went back to, against 5 for a single pass: 3.40× the loss for 1.32× the characters freed.
The first pass is the efficient one and that is structural: it compacts the whole
accumulated backlog at once, where the cheap bulk is, at
0.058 lost outputs per 10,000 characters freed. Every pass
after it works on fresh material only and pays 0.25 to
0.71, four to twelve times as much. It is still not an
argument for stopping at one, because the alternative to pass two is not keeping
everything: it is the model summary, which keeps no tool output verbatim at all. But the
price is on the page rather than under it, and maxPasses: 1 buys the
cheap pass and nothing else.
03What it gives back
Room back, and the model call that never runs.
Half of it is room to keep working in. The other half is what the loop defers, which is not a pause: it is a model call.
What one compaction freed, on each of the 4 largest sessions on one machine
- 66 calls8.7%7k tokens
- 49 calls9.1%4k tokens
- 473 calls18.0%49k tokens
- 3,003 calls32.0%677k tokens
29.3% freed across all 3,591 calls8.7% to 32% per session
npm run dry-run measures yours.And nine model calls that did not happen
10 engine summaries deferred, across 4 of the 5 sessions measured
1,240,000 input tokens not sent 0 tokens spent answering 8 ms each, on this machine
04The shape of it
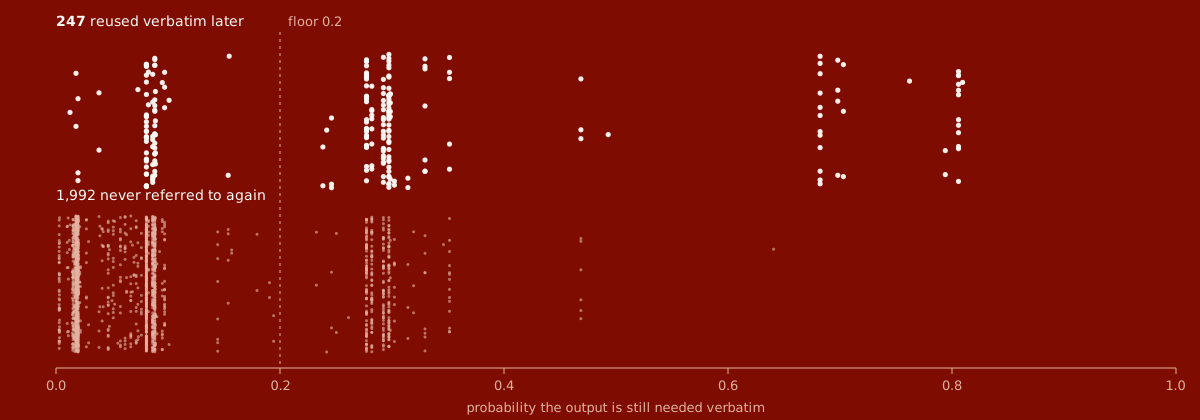
Two thousand two hundred and thirty‑nine decisions.
Every labelled call in the corpus, placed by the probability the shipped model gives it. Above the line, the ones whose output really was reused verbatim later; below, the ones that never were. A single AUC is a summary of this picture.
Every one of the 2,239 decisions, plotted
A fixed cut at 0.50 would sweep 212 of the 247 reused outputs with it: 86% of the work this is here to protect.
05–08Elsewhere
The arithmetic, and the settings it decided.
Two kinds of page behind this one: what every figure here cost to produce, and the sweeps that chose the numbers the loop runs on.
-
Evidence · four sections
What you repeat, cost, where it loses, and what is not verified
What your sessions spend rediscovering, what it costs to run, the outputs it dropped that were needed, and the claims this project has not established. They left this page when it reached seventeen thousand pixels; the numbering runs straight through.
-
Study · the loop’s two settings
Where to compact, and how much
Claude Code compacts at its own threshold and goes first, so kompact has to answer under it. The grid says how far under, and says plainly that the floor shipped here is not the floor that measured best.
09Install
See your own number first, then install.
Before installing anything, run it against your own sessions. It scores the transcripts already
in ~/.claude/projects with the same code the hook calls, prints what one compaction
would free and how many passes the loop would take before handing over — and writes
nothing, installs nothing, sends nothing.
Needs git and Node 18 or later; with no sessions there it has nothing to score and
says so. Section 06, Cost has the range to expect.
shell · nothing installed
git clone https://github.com/AxeForging/kompactcd kompactnpm installnpm run dry-runThen install it. Function hooks are early access: tested on Claude Code 2.1.281, so that or later works and below it is unknown rather than broken; which release first shipped them is not established here. The variable must be exported before Claude Code starts — put it in your shell startup file, or the plugin installs and silently never runs.
shell · then install it
export CLAUDE_CODE_ENABLE_FUNCTION_HOOKS=1claude plugin marketplace add AxeForging/kompactclaude plugin install kompact@kompact
Did it fire? The next compaction prints kept N/M messages, no summary (…);
silence means it never ran. npm run doctor checks the variable, your Claude
Code version, and that the plugin is installed and firing — all at once — and the
checks are spelled out below.
It replaces compaction rather than repairing it: Claude Code’s session.compact
hook returns a replacement message list. Any failure at all (scorer down, malformed
response, or a saving below the minimum) falls back to the built-in summary.
What it touches, and what it never touches
Compaction changes nothing on disk. It rewrites what is sent to the model for
the rest of the session; the transcript in ~/.claude/projects is untouched, and
uninstalling puts the next compaction back to Claude Code’s own summary. By default the plugin
writes nothing on disk at all; the optional recorder keeps counts in
~/.claude/kompact‑signals.json only if you turn it on with
recordSignals. Everything below is the shipped behaviour, not a
policy: each line is a default in src/compact.ts or a guard the scorer does not get
a vote on.
If nothing happens
It says so, every time it fires. Each compaction raises a notice reading
kept 202/260 messages, no summary (pass 1 of 6, freed 10.9% of the context window;
    17% reduction;
    40 kept, 2 results truncated, 29 calls dropped, 2 pinned;
    71 scored; compacted in 16ms)
, and writes the same line, plus
one per decision, to the session log. If anything goes wrong you get
fallback to built-in summary (…) instead, naming the reason. Silence is a
different thing: the hook never ran, which is a setup answer rather than a bad decision.
npm run doctor runs the two checks below plus the version and whether it
has fired, and prints the fix for each. By hand, in this order:
echo $CLAUDE_CODE_ENABLE_FUNCTION_HOOKSmust print1. Empty is the usual answer and the usual cause. It has to be exported before Claude Code starts, and it has to be in your shell’s startup file to survive the next terminal.claude plugin listmust showkompact. If it does, the variable is1, and no notice ever appears, the build is older than function hooks: see the version rule above.
Everything it touches, in full
- The last six messages are never touched, whatever they contain.
- Your prose and the assistant’s is never touched. Only tool results and tool calls.
- A shortened result keeps its first 300 characters, so the call is still legible and the tool can be run again.
- A call that recorded a change (
Edit,Write,MultiEdit,NotebookEdit) is never dropped, whatever it scores. - A kept result is still capped at 24,000 characters, because half of all tool output lives in about 3% of the calls.
- It answers at most six compactions on one session, and only while a pass reclaims five points of the context window. After that Claude Code's own summary runs.
- Compaction changes nothing on disk. It rewrites what is sent to the model for the rest of
the session; the transcript in
~/.claude/projectsis untouched. - The plugin writes nothing on disk by default. Turn the recorder on with
recordSignals: trueand it keeps counts of the shapes you repeat in~/.claude/kompact‑signals.json— capped, never leaving the machine. From those counts it can draft a reusable skill for a repeated flow, or scaffold a runnable tool — an actual script file with a shebang, the detected imports and a stub — from an ad-hoc one you keep re-writing (python -c, a heredoc), clustered by what the script does rather than its filename. Proposals land in.kompact/proposals/, which Claude Code does not read; promoting one is amvyou do yourself. - Remove it with
claude plugin uninstall kompact, or unsetCLAUDE_CODE_ENABLE_FUNCTION_HOOKSto turn every function hook off. Either way the next compaction is Claude Code’s own summary again.